
Inside CATL’s Manufacturing Advantage
How CATL became one of the most important companies in the global electrification supply chain. (300750 CN / 3750 HK).
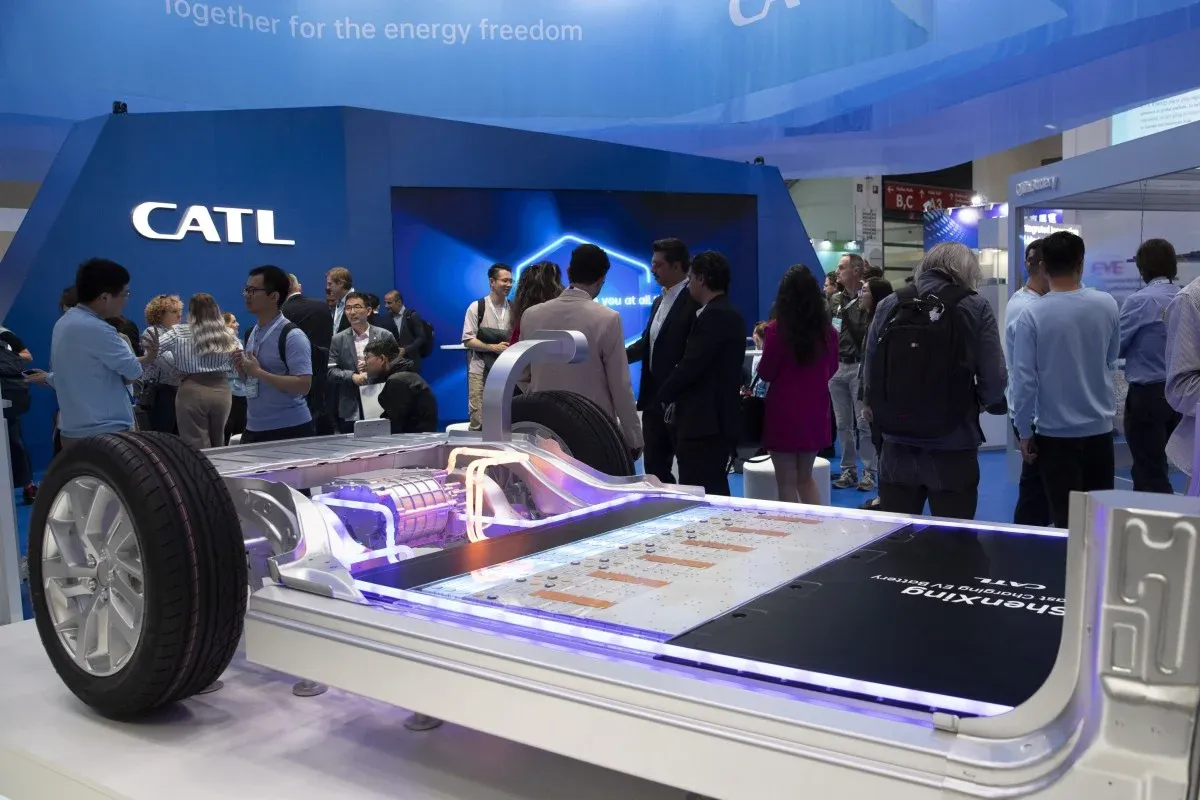
Disclaimer: Frontier Lane provides this content for informational and educational purposes only, not as investment advice. We hold no position in this security as of the publication date. Please read our full Disclaimer for more information.
The Quiet Giant Behind The EV Era
If you've driven a Tesla Model 3, charged a BMW iX, or walked past a grid-scale battery farm, chances are the cells inside came from a Chinese company you know by name but little else: Contemporary Amperex Technology Co., Limited (CATL), the world's largest battery manufacturer.
The origin story is an unusual one. Robin Zeng co-founded Amperex Technology Limited (ATL) in 1999, making lithium-ion batteries for consumer electronics and eventually supplying Apple's iPod. When Beijing began subsidising EVs in 2009, Zeng took a bet. He spun out ATL's EV battery division in 2011 into a new entity, CATL. Fifteen years later, that spin-off dictates the pace of the global battery industry.
The sheer scale is striking. In 2025, CATL generated US$61 billion in revenue and US$10.4 billion in net income, supported by 132,000 employees and a US$250 billion market cap. But the real story is their dominance. They hold a 38% global market share in EV battery production. They have ranked first in EV shipments for eight consecutive years, and led global energy storage for four. In May 2025, they completed Hong Kong's biggest IPO of the year, with shares jumping 18% on debut despite a heavy geopolitical backdrop.
Today, CATL is critical infrastructure for two of the defining transitions of our time: vehicle electrification, and the build-out of grid-scale storage to support renewables and AI data centres. It also sits squarely in the crosshairs of US-China industrial policy. This makes it simultaneously one of the most operationally impressive companies in the world, and one of the most geopolitically sensitive.
Understanding CATL is, in many ways, understanding how the global energy system is being rewired. In this deep dive, we unpack CATL's competitive positioning, industry structure, technology roadmap, unit economics, and how we are thinking about valuation.
Industry Dynamics: The Consolidation Era
A brutal cyclical reset
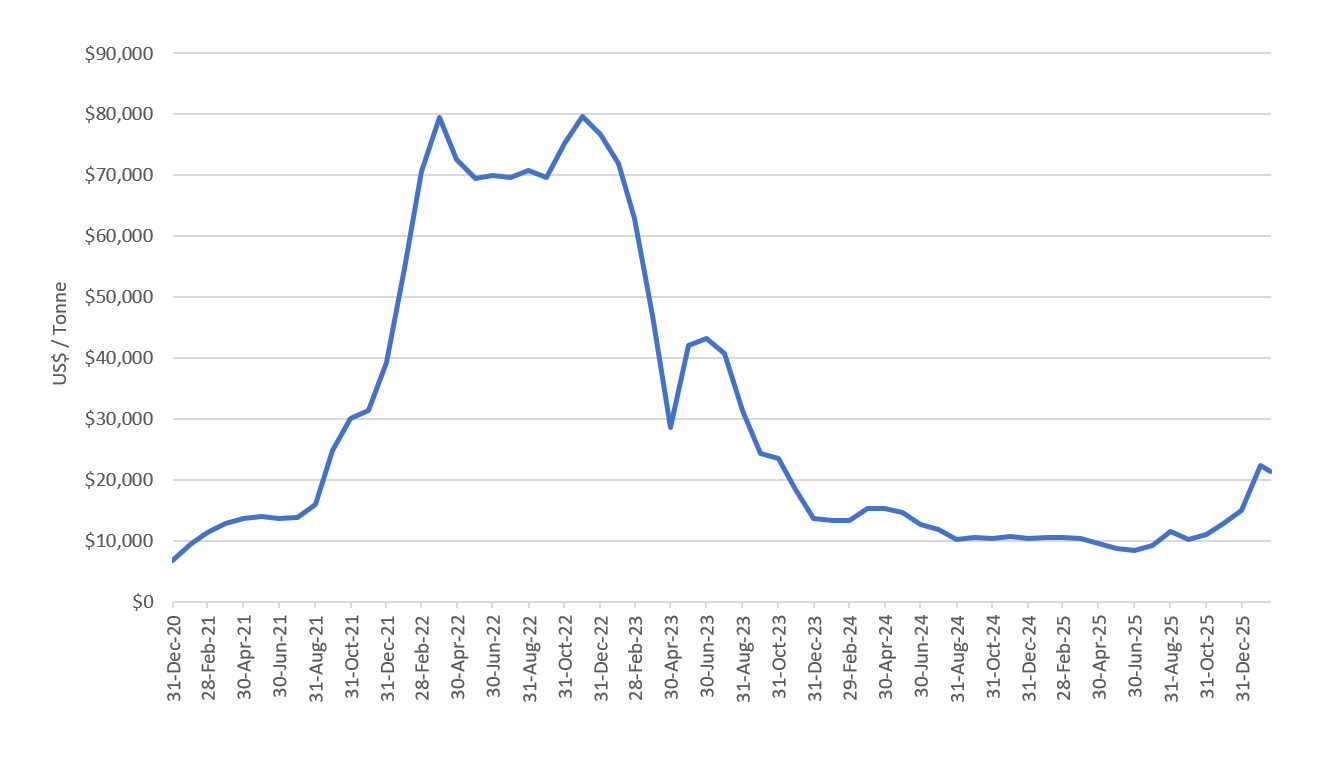
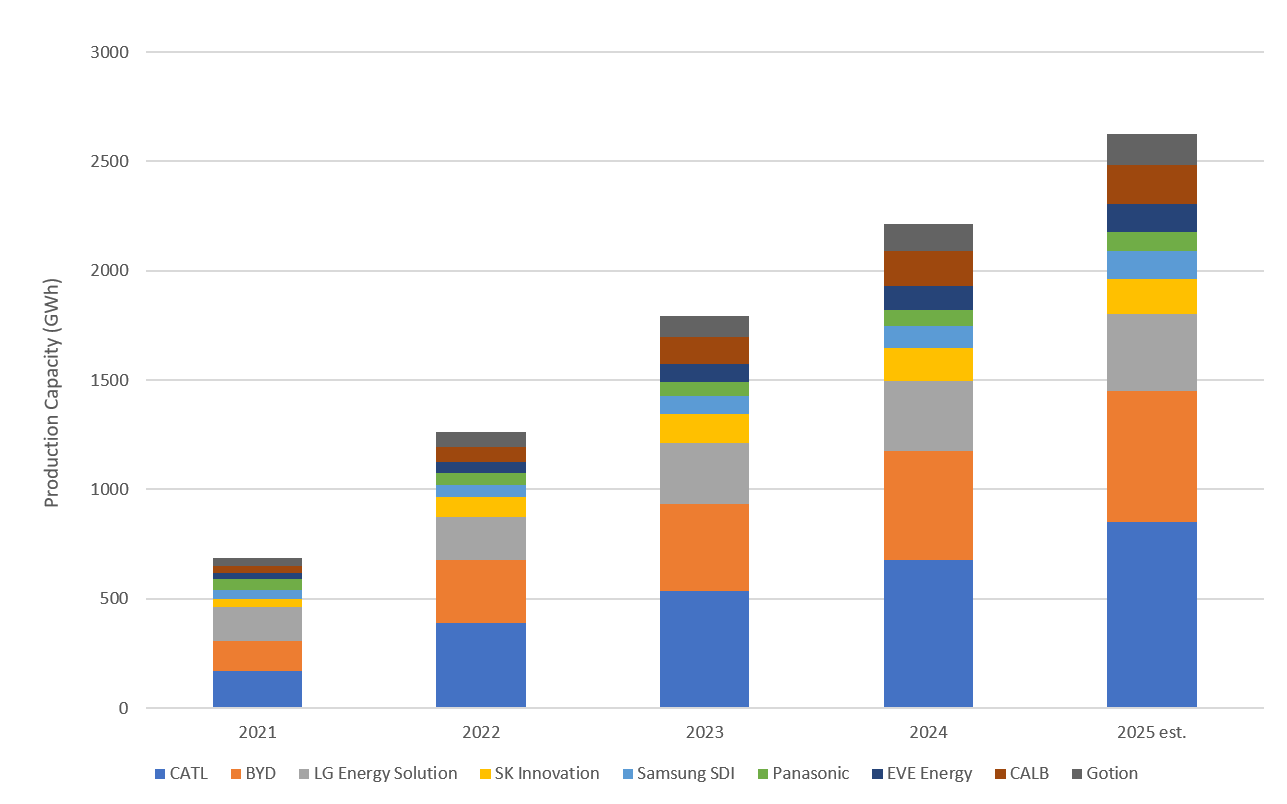
The global battery industry is finally putting one of the most punishing cycles in its short history behind it. After the lithium price boom of 2021 to 2022, manufacturers raced to expand capacity, betting heavily on continued, exponential EV growth. From 2021 to 2023, global battery capacity surged at a 60% CAGR. Then reality set in. Lithium prices collapsed, EV demand normalised, and a severe price war compressed margins across the board. Capacity growth has since cooled to the high teens.
But CATL came through it stronger. While most peers were forced to slash capex, rationalise hard, and rethink their target markets, CATL kept executing. With that painful reset now largely complete, the industry is visibly splitting into geographic camps. Korean players like LG Energy Solution and Samsung SDI are retreating to the US, particularly in energy storage, where simply being non-Chinese is now a commercial advantage. Meanwhile, CATL and BYD dominate China and most of the rest of the world.
The reality is that the industry has stopped competing on the same battlefield. Scale and cost still matter, but where you sit on the geopolitical map increasingly dictates who you can actually sell to.
Lithium carbonate price (China battery grade US$/t)
Battery Production Capacity (GWh) grew at 60% CAGR from 2021 to 2023, currently growing around high teens %
China dominates, and the West can't easily escape it
China doesn't just participate in the global battery supply chain; it dominates it, accounting for over 70% of total cell manufacturing. This grip is heaviest in the midstream and processing sectors: China refines more than half the world's battery metals and churns out over 85% of critical components like anodes and electrolytes.
Decades of targeted industrial policy, unmatched manufacturing scale, and deep process know-how have built a cost and efficiency advantage that is extraordinarily difficult to replicate, especially downstream from the lithium refinery stage. Protectionist trade policies have certainly intensified Western efforts to break this dependence, driving major structural changes in what was once a singular global supply chain.
But building a competitive, non-Chinese alternative is proving harder than policymakers hoped. Subsidies alone cannot replicate decades of accumulated industrial expertise. The likely outcome isn't true Western independence. Instead, we are looking at a slower, structurally more expensive parallel supply chain built to serve politically sensitive markets.
Technology transitions are the defining risk
Battery industry leadership has historically reset about once a decade. The transition from NMC (Nickel Manganese Cobalt) to LFP (Lithium Iron Phosphate) chemistry is the most recent example. Chinese manufacturers aggressively backed LFP, while Korean and Japanese players stuck with NMC. That single strategic call largely explains why CATL leads the market today.
Now, two new transitions are on the horizon. First is sodium-ion. It is approaching commercial viability, particularly for lower-cost EVs and grid storage, and CATL is incredibly well positioned here. Second is solid-state, which poses the larger long-term threat. Toyota is pushing the hardest. While commercial scalability remains uncertain, successful mass adoption could entirely reshape industry economics. We unpack this further in the risks section.
Battery pack prices fall in 2025, despite rising metal prices
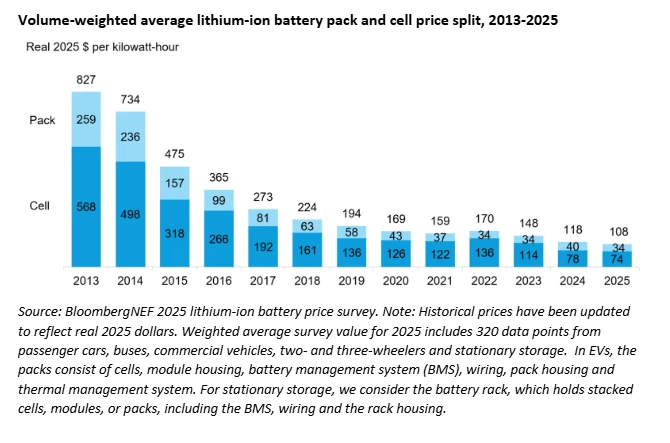
Despite rising metal prices in 2025, battery pack prices continued to fall. This reflects relentless manufacturing efficiency gains alongside brutal competitive pressure. Scale leaders with superior yields and procurement leverage are the only ones positioned to absorb this squeeze. CATL sits firmly at the top of that list.
A realigned competitive landscape
The 2023 to 2024 downturn effectively separated the field. We are left with a handful of scaled survivors that have strengthened their market positions. CATL and BYD are the clear Chinese leaders, though BYD benefits heavily from captive demand from its own vehicle business. The Korean trio of LG Energy Solution, Samsung SDI, and SK On are pivoting hard toward the US. Non-Chinese supply commands a premium there for Inflation Reduction Act qualifying projects, but their margins remain weak and capex is actively being cut. Panasonic remains tied to Tesla but has lost relevance almost everywhere else. Below the top tier and without scale, it is difficult for mid-sized players. Northvolt's collapse in 2024 was the most visible failure, and players like SVOLT have repeatedly delayed IPOs as market conditions soured.
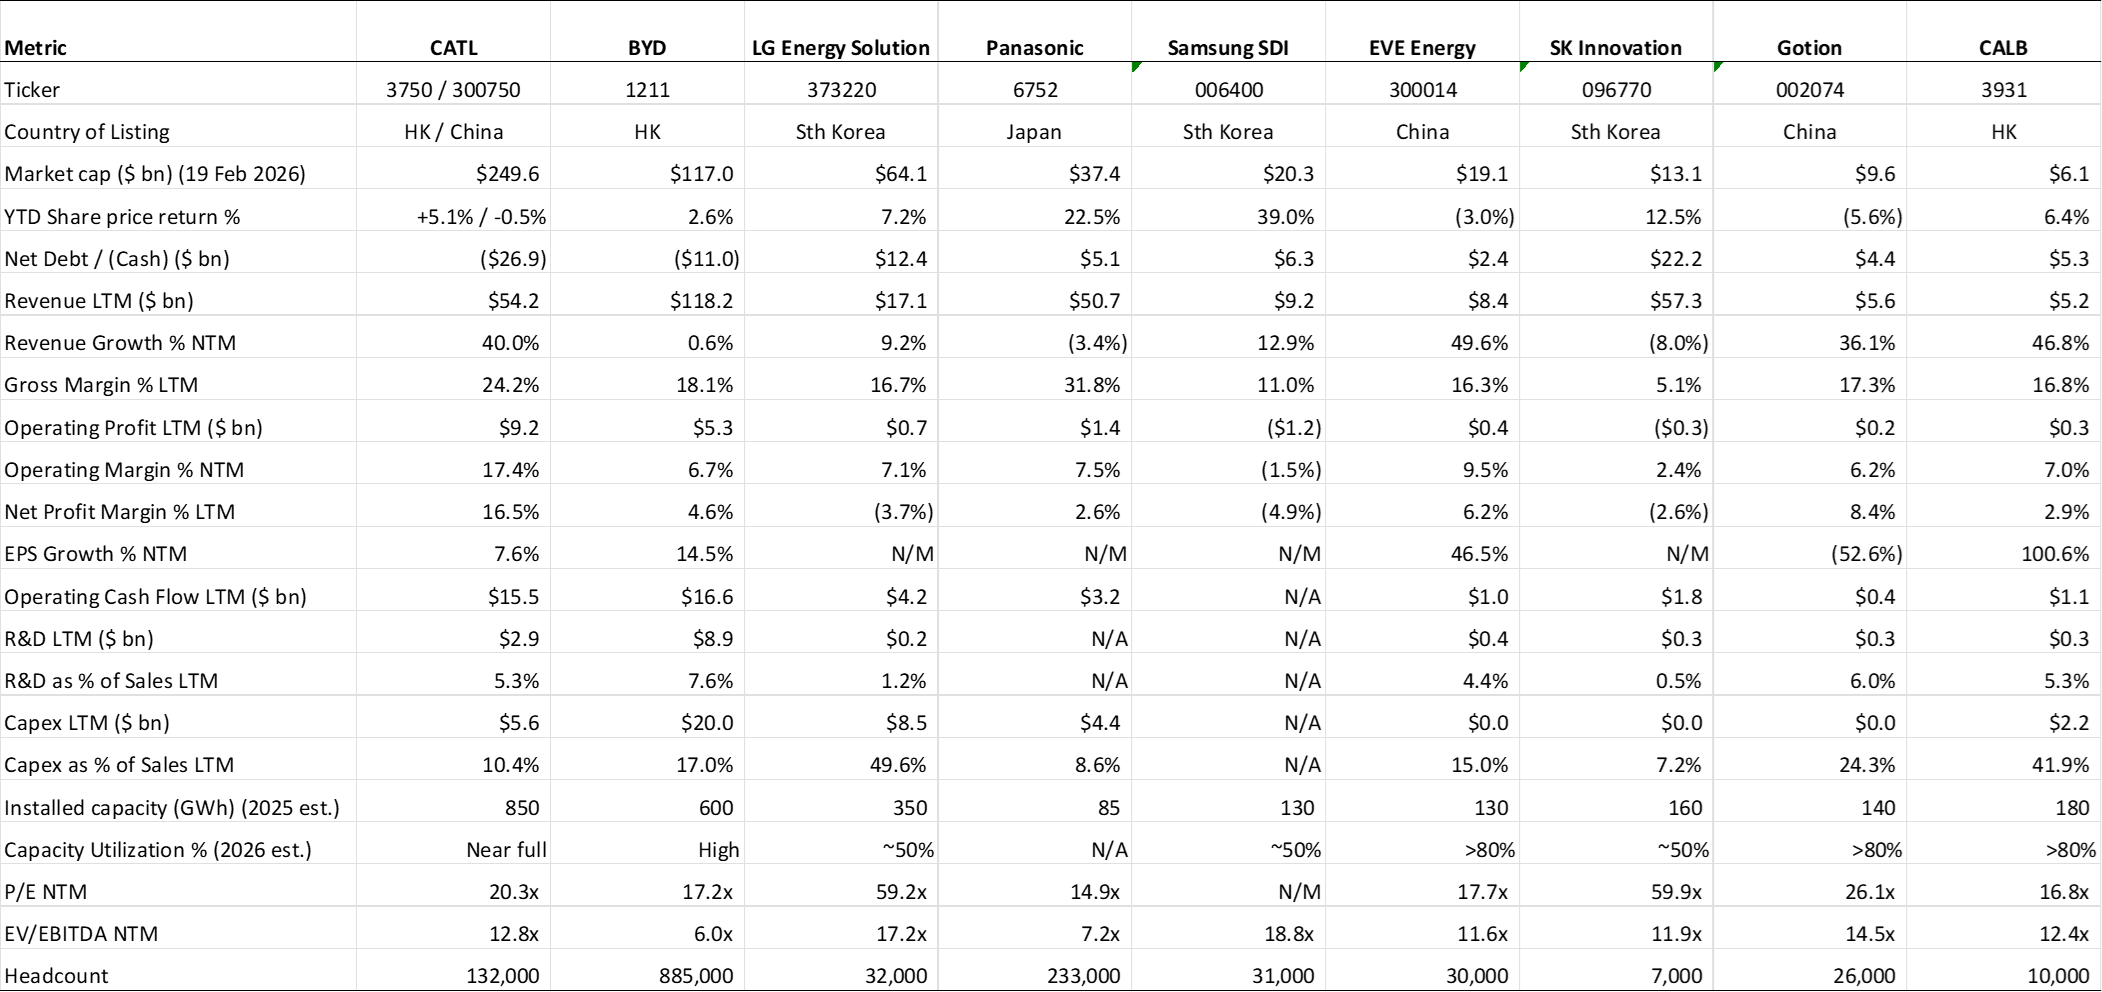
When you look at the operational metrics, CATL leads on almost every front. They boast gross margins of 24%, compared to the Korean trio languishing in the low-to-mid teens. Their operating margins sit at 17%, while peers show single digits or negative returns. Crucially, CATL holds a $27 billion net cash position, whereas Korean players are carrying massive debt loads.
CATL's Competitive Moat
Scale that bends the cost curve
CATL produces around 38% of the world's EV and ESS batteries. That is more than twice the volume of its nearest competitor, BYD, and triple the nearest ESS competitor, EVE Energy. They are also the only player with true scale across both major chemistries. They dominate LFP for the Chinese market and entry-level EVs, and they dominate NCM for premium vehicles and Western markets.
That scale shows up immediately in pack cost. CATL and BYD sit at the absolute bottom of the global cost curve at roughly $50 to $60 per kWh for LFP packs. Compare that to the global blended average of around $108, or Western producers in the US and EU sitting at $120 to $130. This gap is so wide that government subsidies are the only thing keeping non-Chinese supply commercially viable in most markets.
Global cost curve for battery manufacturers

Three factors produce this advantage. First is procurement leverage. CATL simply buys more lithium, graphite, and cathode material than anyone else, securing LFP raw materials at roughly 10% below industry averages. Second is throughput. Their next-generation mega-factories, like Jining, produce over 220,000 battery cells a day. With cycle times under two seconds per cell, they generate manufacturing costs 42% below legacy lines. Third, dual-chemistry coverage spreads fixed R&D and process knowledge across both LFP and NCM platforms. Korean and Japanese players simply cannot replicate this at the same scale.
This scale extends upstream too. CATL holds equity stakes in lithium, cobalt, and nickel assets across China, Africa, and South America. Vertical integration is not a moat on its own. However, it gives CATL a partial commodity hedge and procurement flexibility that smaller players lack. We saw this strategic value clearly in August 2025. CATL suspended operations at their Yichun lithium mine as prices weakened. Because the mine accounts for 6% to 8% of China's domestic lithium output, prices actually moved on the news. Very few battery manufacturers can singlehandedly influence the underlying commodity market.
The brutal 2023 to 2024 downturn actually widened these advantages. Today, CATL and BYD are operating at near-full utilisation and ramping capex again. Meanwhile, LG Energy Solution plans to cut 2026 capex by 40%, and Samsung SDI has signalled reductions based on investment efficiency. The Chinese duopoly is leaning in, while the Korean field is rationalising. By the time the next cycle begins in earnest, this gap will only be wider.
Yield is the hidden moat
The single most underappreciated metric in battery manufacturing is yield. This is the percentage of cells produced that are sellable without defects. A 1% yield advantage translates roughly into a 1% gross margin advantage. The difference between a 95% yield and a 70% yield is quite literally the difference between a cash-generative business and a cash-burning one.
Battery yields across battery manufacturers

Most competitors measure their defects in parts per million. CATL measures theirs in parts per billion. Their warranty claim rate is around 0.2%, making it the lowest in China. When Morgan Stanley recently benchmarked CATL batteries against BYD, LG, and Samsung SDI across two million kilometres of driving, they found CATL had materially lower degradation.
These high yields are persistent because they stem from accumulated industrial process expertise rather than a single technology breakthrough. CATL designs portions of its own production equipment internally, including winding and coating machines. This reduces reliance on third-party suppliers and prevents equipment vendors from selling CATL's process know-how to rivals. Their plants run on a proprietary Manufacturing Execution System and digital-twin technology. Over 10,000 sensors per line monitor temperature, humidity, viscosity, pressure, and coating consistency in real time. If the humidity in the room shifts by 1%, the system automatically adjusts the drying oven temperature by 0.5 degrees before the next cell even enters production.
This is the kind of moat that compounds. Higher yields mean lower material waste, higher factory utilisation, and better unit economics. Those economics fund more R&D and automation, which in turn improve yields further. It is also genuinely hard to copy quickly. Manufacturing quality at this scale is the product of a decade of operational learning. It is not something a well-funded entrant can simply buy off the shelf.
R&D scale and technology track record
To understand CATL's edge, look at their R&D commitment. They spend roughly $2.9 billion a year and support a 20,000-person research organisation. That is 7 to 10x what most battery competitors spend. BYD spends more in absolute terms, but since BYD is primarily an automaker, most of that capital goes to vehicle development rather than pure battery innovation.
Scale in R&D matters because battery technology turns over roughly once a decade. The winners are simply the players who call the next chemistry correctly and commercialise it fastest. The most recent transition is the clearest example. LFP went from 10% of the China market in 2019 to roughly 80% in 2025. CATL and BYD positioned themselves heavily in LFP, while Korean and Japanese players stayed focused on NCM. That single call largely explains why CATL is the global leader today and why Panasonic, LG, and Samsung SDI are not.
The product portfolio reflects what that R&D buys. Platforms like the Shenxing fast-charging LFP and the Qilin high-energy-density battery have created a premium tier above commoditised cells. In this tier, CATL commands pricing power that smaller Chinese players cannot match. Their Cell-to-Pack architecture was central to LFP leapfrogging NCM, as it packs more active material into the same chassis to compensate for LFP's lower energy density.
According to CATL, the next transition is sodium-ion. Energy density is approaching LFP and costs are structurally lower. Robin Zeng has publicly stated this transition could happen at double the pace of NMC to LFP, and CATL is already the clear leader here.
Solid-state technology is the harder question. Toyota holds most of the foundational patents and has guided to mass production in 2027 or 2028. Robin Zeng has publicly questioned whether the physics of clamping a solid electrolyte against a cathode and anode will work commercially at scale. CATL is positioned as a fast follower rather than a leader in this space. This is a low-probability but high-impact risk. If Toyota succeeds, CATL's moat narrows. If the physics fail to scale, CATL's bet looks prescient. It is a dynamic worth monitoring closely.
Customer lock-in and embedded position
Battery supply relationships have evolved from basic procurement contracts into multi-year strategic partnerships. CATL has used its scale to embed itself deeper into customer architectures than any competitor.
This lock-in starts during vehicle design. CATL engineering teams work inside OEM research departments years before a vehicle ever launches, co-developing the battery for specific vehicle platforms. Once an automaker like Tesla or BMW designs a chassis around CATL's proprietary Cell-to-Pack architecture, switching to an LG or Panasonic battery is no longer just a procurement decision. It requires redesigning the vehicle, recertifying safety systems, and revalidating the thermal and software stack. The switching cost becomes structural.
CATL also goes further than most component suppliers in two unique ways. First, they form joint ventures rather than standard supply contracts. This includes a co-development deal with Volkswagen and a JV with Stellantis to build a plant in Spain. They locate manufacturing capacity right next to customer assembly lines in Germany, Hungary, Spain, Indonesia, and Thailand. Second, they market directly to end consumers through the "CATL Inside" label. This is the kind of brand strategy normally reserved for companies like Intel or Bosch, and it is explicitly designed to pressure OEMs into maintaining the relationship.
The customer base has also broadened well beyond automakers, encompassing grid operators, hyperscalers, and major utilities, a shift covered in detail in the next section.
The Inflation Reduction Act and steep tariffs on Chinese batteries have pushed US buyers toward Korean LFP supply, and those Korean players have responded aggressively.
CATL's workaround is the Licence Royalty Service model. They licence technology and factory designs to partners like Ford in Michigan in exchange for royalties. This model is capital-light and carries gross margins above 50%, preserving Western exposure without requiring a direct manufacturing footprint. However, it only sits at around 5% of revenue and is at constant risk of being closed by US legislation.
The Growth Engine Beyond EVs
CATL spent its first decade operating as a conventional battery manufacturer. It was a highly cyclical, capital-intensive industrial business. Its fortunes closely tracked the price of lithium alongside the global EV adoption curve.
The next decade looks structurally different. Two major shifts are happening at once. First, the customer base is rapidly broadening from automakers to grid operators and hyperscalers. Second, the financial profile is moving away from heavy capital expansion and toward sustained cash generation.
Together, these shifts completely reposition the company. CATL is no longer just a conventional cell maker. It is becoming foundational electrification infrastructure.
ESS is the second growth engine
For the last decade, EVs have been the uncontested engine of global battery demand. That era of secular, uniform acceleration is now over. The EV market is undeniably maturing and diverging by region as subsidies fade and adoption normalises. China remains the world's largest EV market and grew sales 17% in 2025, but early 2026 has shown signs of slowing. The US market has effectively stalled out. We saw just 1% growth in 2025, tax credits ended in September 2025, and legacy automakers are shifting focus towards hybrid technology. Ford recently wrote off $19.5 billion in EV assets, and GM wrote off $6 billion. While Europe remains a bright spot with 33% growth, the overall picture is clear. We are looking at regional bifurcation rather than structural global expansion.
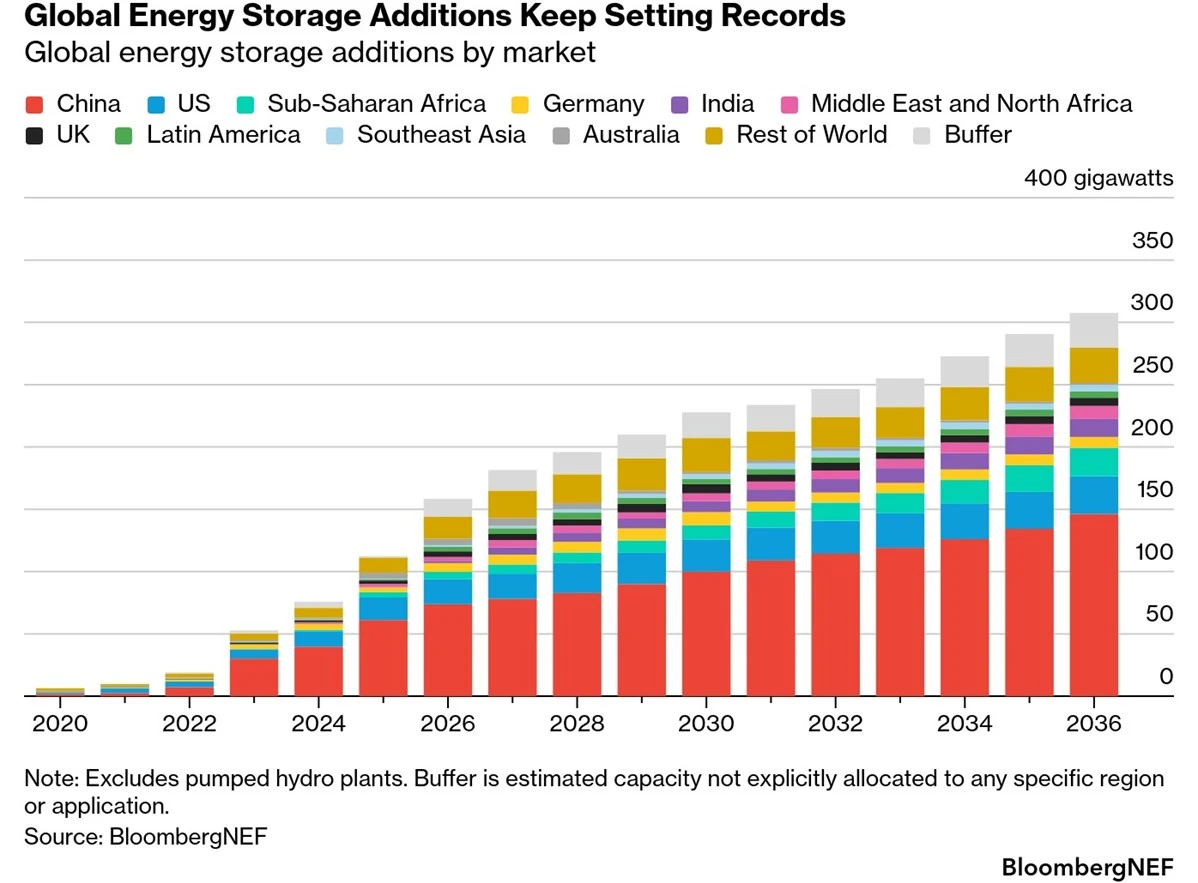
Energy storage, or ESS, is stepping up as the second major demand pool, and it represents a completely different shape of demand. This market was effectively non-existent in 2020, but it is now expected to grow at an annual rate in the mid-20s percent range through the next decade. A perfect storm of renewable energy deployment, global grid modernisation, and AI-driven data centre power needs is supercharging large-scale storage infrastructure. Make no mistake. This is now the contested ground in the battery industry, and exactly where CATL's next decade will be decided.
China alone is targeting 180 GW of national energy storage capacity by 2027. In response to this structural pull, CATL revised its 2026 production guidance upward by 30% in late 2025. They are now targeting 1,300 GWh, up from roughly 850 GWh in 2025, with the bulk of that increase tied directly to ESS.
The customer base tells you exactly what kind of business this is becoming. ESS buyers include Fluence, Tesla Energy, NextEra, and Sungrow. It includes hyperscalers like Microsoft and Google, alongside major US utilities such as Duke and Dominion. These are infrastructure buyers. They operate with multi-decade planning horizons and massive, often regulated, capital budgets. Their demand scales with renewable deployment and electricity load growth, not with consumer car purchases.
However, one caveat is that ESS is not uniformly strong everywhere. Global share slipped from 43% in 2022 to 37% in 2024, and the US is the main source of that leakage. Steep tariffs on Chinese batteries, alongside Inflation Reduction Act restrictions and Foreign Entity of Concern rules, have pushed US buyers toward Korean LFP supply. The non-US ESS market remains structurally favourable, but the US is structurally difficult and will likely stay that way.
ESS market is expected to grow mid 20s% annually
Unit economics are inflecting
The cycle has actually done CATL a massive favour. Through 2021 to 2022, lithium peaking near $80,000 per tonne squeezed gross margins to around 17%, even as revenue grew 152%. Then, through 2023 to 2024, lithium crashed to $10,000 per tonne. This pushed gross margins back up to 24% despite a 10% revenue decline, demonstrating real pricing power.
Stabilisation in the $15,000 to $20,000 per tonne range is the absolute sweet spot. Raw materials are cheap enough to support healthy margins. They are expensive enough for CATL's internal mining division to operate profitably. Crucially, they are uncomfortable enough to keep Tier 2 and Tier 3 competitors bleeding cash.
The financial profile is shifting accordingly and there is meaningful leverage on gross margins. Capex intensity is falling as the heaviest expansion phase passes, pushing free cash flow margins into the mid-teens. This is simply no longer a business that requires every single dollar of operating cash flow to be reinvested into new capacity just to stay competitive.
Illustrative lithium price scenarios
|
Lithium price scenario |
$10,000 / tonne |
$15-20,000 / tonne |
$80,000 / tonne |
|
Gross margin |
High
(~25%) |
Highest
(~25%+) |
Low (~17%) |
|
Competitor
threat |
Low (Others
bleeding cash) |
Moderate |
High
(invites competition) |
|
Internal mining |
Suspended
(loss-making) |
Operating
at slight profit |
Highly profitable |
Illustrative unit economics of CATL’s batteries

Two further developments support this cash generation thesis. First is the Licence Royalty Service model. After Foreign Entity of Concern rules locked CATL out of direct US manufacturing, they pivoted to licensing technology and factory designs to partners like Ford in exchange for royalties. Gross margins here are above 50%. The revenue contribution is small at around 5% of the total, but it is high-quality and capital-light. The model remains at constant risk of being closed by US legislation, but for now, it perfectly preserves Western exposure without requiring a massive capital commitment on US soil.
The second development is shareholder returns. CATL paid a $3.6 billion special dividend in March 2025 ahead of its $5.2 billion Hong Kong IPO in May. While this sequencing closely resembled a pre-IPO dividend strip, it nonetheless signalled a shift in how management thinks about cash, showing confidence in its forward cash generation.
The result is a company whose financial profile starts to resemble a mature industrial giant. Think Honeywell, Siemens Energy, or Emerson Electric rather than a conventional battery manufacturer. That comparison matters deeply for valuation, which is exactly how the market will need to judge this business going forward.
Key Risks
The moat is wide, but below, we have identified key points to monitor. They are ordered roughly by how likely they are to compress the thesis over the next three to five years.
Solid-state batteries are the asymmetric technology risk
Battery industry leadership has historically reset about once a decade. LFP overtaking NMC over the last five years is the most recent example, and it is the exact transition that built CATL's current lead. The next potential reset is solid-state, and CATL is not positioned to lead it.
Toyota holds most of the foundational solid-state patents. They have guided to mass production in 2027 or 2028 with a sulphide-based battery offering 1,000 kilometres of range and ten-minute charging times. Robin Zeng has publicly questioned whether the physics of clamping a solid electrolyte against a cathode and anode will ever scale economically. Consequently, CATL has positioned itself as a fast follower rather than a leader. This is a highly coherent bet. Most attempts at solid-state manufacturing have struggled with yield at scale, and CATL's broader strategic focus remains squarely on sodium-ion, which is closer to commercial readiness.
The asymmetry is what makes this a real risk rather than just a theoretical one. If Toyota's physics actually work, the manufacturing process moat partially resets. Solid-state requires completely different production techniques, meaning a decade of yield optimisation on lithium-ion matters far less. If it fails to scale, CATL's bet looks prescient and the moat widens. This is something to monitor through 2027 Toyota production milestones rather than something to act on today.
Sodium-ion is the much more constructive technology story. Energy density is rapidly approaching LFP and costs are structurally lower. Zeng has even suggested this transition could happen at roughly double the pace of NMC to LFP. Considering LFP went from 10% of the China market in 2019 to 80% in 2025, that is a staggering pace. CATL is the clear leader here. On the technology axis, sodium-ion strengthens the moat while solid-state threatens it.
Geopolitics narrows the moat in specific markets
That impressive 38% global market share masks a structural problem in the West. As noted above, US energy storage share has already slipped from 43% in 2022 to 37% in 2024. Tariffs above 40% on Chinese batteries, Inflation Reduction Act restrictions, and Foreign Entity of Concern rules have aggressively pushed US buyers toward Korean LFP supply. The Korean players have responded in kind. The non-US opportunity, which spans China's 180 GW national target, Europe's accelerating renewable buildout, and a wave of hyperscaler procurement, is large enough to absorb US leakage several times over. The US is a structural headwind, not a thesis breaker.
The Licence Royalty Service model is CATL's primary workaround. By licensing technology and factory designs to partners like Ford in exchange for royalties at gross margins above 50%, they preserve Western exposure without the capital commitment of a US footprint. It remains highly profitable on a unit basis. But sitting at around 5% of revenue, it is at constant risk of being legislated out of existence. The model is a hedge, not a permanent solution.
Fortunately, EV lock-in is far more durable than energy storage because the switching costs are structural. Once an automaker designs a vehicle chassis around Cell-to-Pack architecture and integrates the battery management system, swapping suppliers requires entirely redesigning the vehicle. Energy storage simply has lower switching costs. The base case is that CATL's US energy storage share continues drifting lower, while non-US markets remain structurally favourable. Europe is the ultimate swing market. Joint venture manufacturing in Germany, Hungary, and Spain partly offsets the political pressure, but the outlook varies wildly country by country.
BYD is the only peer at cost parity
This risk is underrated in almost all CATL analysis. BYD is the only competitor sitting at the absolute bottom of the cost curve alongside CATL. Furthermore, their external battery business through subsidiary FinDreams is growing rapidly. Tesla, Toyota, Kia, and FAW are all now FinDreams customers. The traditional barrier of automakers being reluctant to buy from a competitor that also makes cars appears to be eroding as FinDreams demonstrates immense scale and quality.
If that resistance breaks down meaningfully, CATL loses its monopoly position at the bottom of the cost curve. Korean and Japanese players are not the real threat here because they cannot match CATL on cost. BYD absolutely can. The competitive question for the next five years is less about whether a Western player can catch up, and more about whether BYD becomes a credible second source for the OEMs that currently single-source from CATL. This is not a 2026 problem, but it may well be a 2028 or 2029 problem.
Cyclicality and Chinese policy risk
The battery industry remains highly cyclical and capital intensive. Battery pack prices fell again in 2025 despite rising metal prices. This reflects continued manufacturing efficiency gains, but it also reflects intense competitive pressure. The current cycle is highly favourable for CATL. Lithium has stabilised in the sweet spot; smaller players are still rationalising, and utilisation is exceptionally high. But the conditions that produced the 2023 to 2024 downturn could reoccur. EV demand softening faster than expected, or another lithium price collapse from oversupply, would rapidly compress margins across the entire industry.
Chinese policy is the harder tail risk to handicap. The Yichun shutdown demonstrated clearly that the government can move global commodity markets through CATL's operating decisions. This works beautifully in CATL's favour when Beijing's interests align with the company's. That same dynamic cuts the other way entirely if they diverge. Unforeseen policy intervention on capacity, exports, or technology licensing is a low-probability but high-impact risk.
Valuing an Industrial Platform
Battery manufacturers have historically been valued as cyclical industrials. These businesses are inextricably tied to commodity prices, capacity cycles, and shifting technology. CATL was no different, and traded perfectly through that pattern. We saw a boom in 2020 and 2021 that took the forward P/E ratio above 100x. A multiyear derating followed through 2024, leading into a sharp recovery as the cyclical reset completed.
However, the crux of our valuation framework today centres on a structural re-rating. If CATL is successfully transitioning from a conventional battery manufacturer into foundational industrial infrastructure, relying on historical peak-to-trough multiples is a mistake. The market is just beginning to recognise this shift.
While consensus often defaults to the forward P/E ratio (currently ~20x), we view this as an imperfect anchor. The sheer scale of CATL's factory depreciation heavily distorts the earnings line. Instead, our framework relies on EV/EBITDA (sitting near 13x) and Free Cash Flow yield (roughly 5%). As the company's capex intensity peaks and rolls over, we expect this cash generation profile to force a fundamental reassessment of the stock's multiple.
We believe the market will increasingly price CATL closer to an infrastructure asset than a highly cyclical auto-parts supplier. The velocity of that re-rating (and exactly where the multiple settles) will depend on three clear catalysts: the durability of energy storage margins, the survival of US licensing workarounds against legislative pressure, and whether competing solid-state technology timelines slip or hold.
Conclusion
The current setup for CATL is exceptionally clean. The company emerged from the recent lithium price collapse and industry-wide capacity glut demonstrably stronger than it entered. While competitors were forced to aggressively rationalise operations and bleed capital, CATL accelerated its investments back into the business. Today, their combination of manufacturing scale, vertical integration, and technological know-how creates a formidable competitive moat.
We are watching a structural bifurcation of the global market. While geopolitical walls are being erected in the West, CATL's domestic Chinese demand alone provides a massive, insulated engine for baseline growth. More importantly, the rapid scaling of grid-level energy storage has fundamentally altered the company's DNA, accelerating its transition from a pure-play battery maker into critical industrial infrastructure.
The risks to our thesis are clearly defined: Toyota's timeline for solid-state commercialisation, further legislative erosion in specific Western markets, and BYD emerging as a peer at true cost parity. However, CATL possesses the balance sheet and R&D scale to manage each of these from a position of immense strength.
Ultimately, CATL is the most deeply entrenched entity serving the global electrification economy. Whether the broader market eventually values the company as a cyclical manufacturer or as the foundational infrastructure of the energy transition is the single most important question for long-term returns. In our view, this structural transition is actively unfolding, and should it fully materialise, the long-term upside may not yet be fully priced in.
Appendices
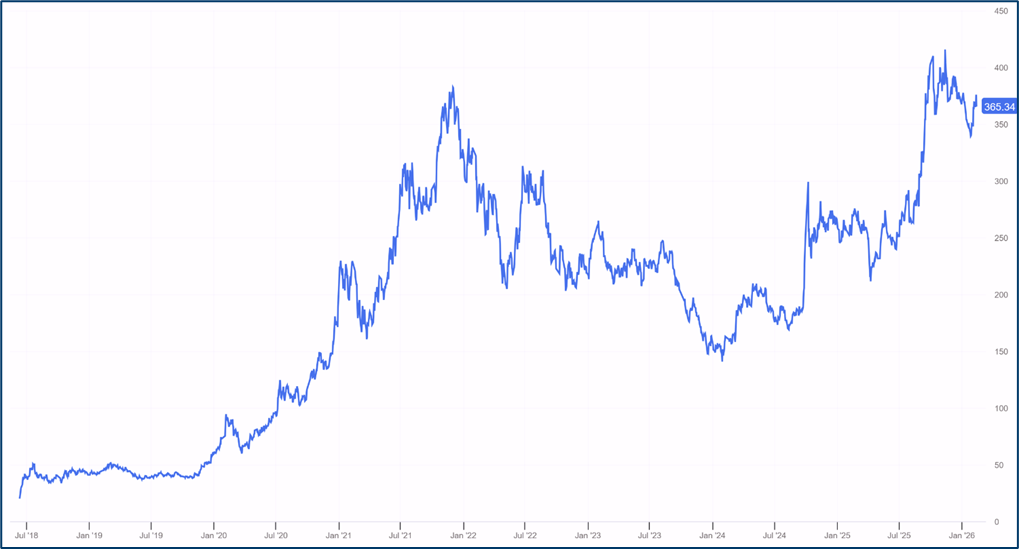
Share price chart (A-share ticker: 300750)
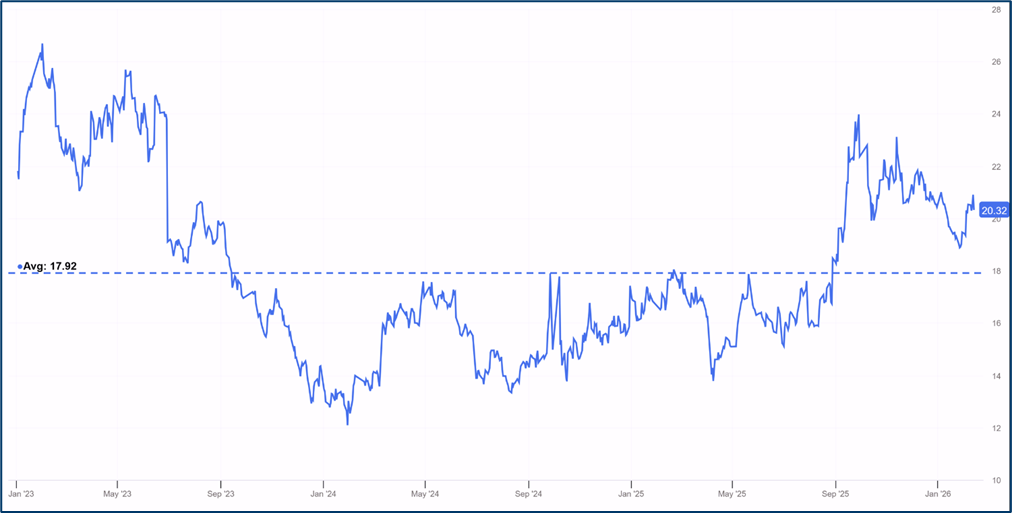
EV/EBITDA NTM last 3 years
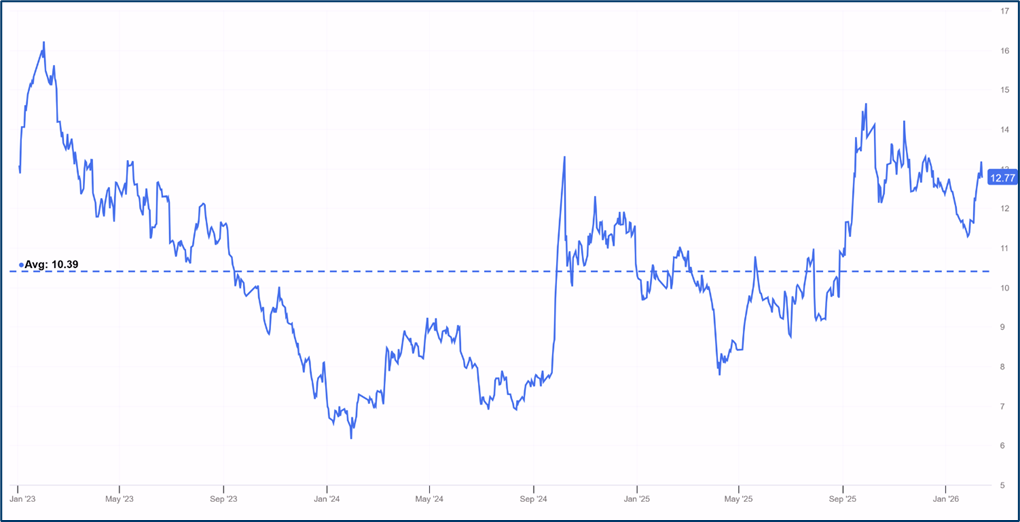
P/E NTM last 3 years
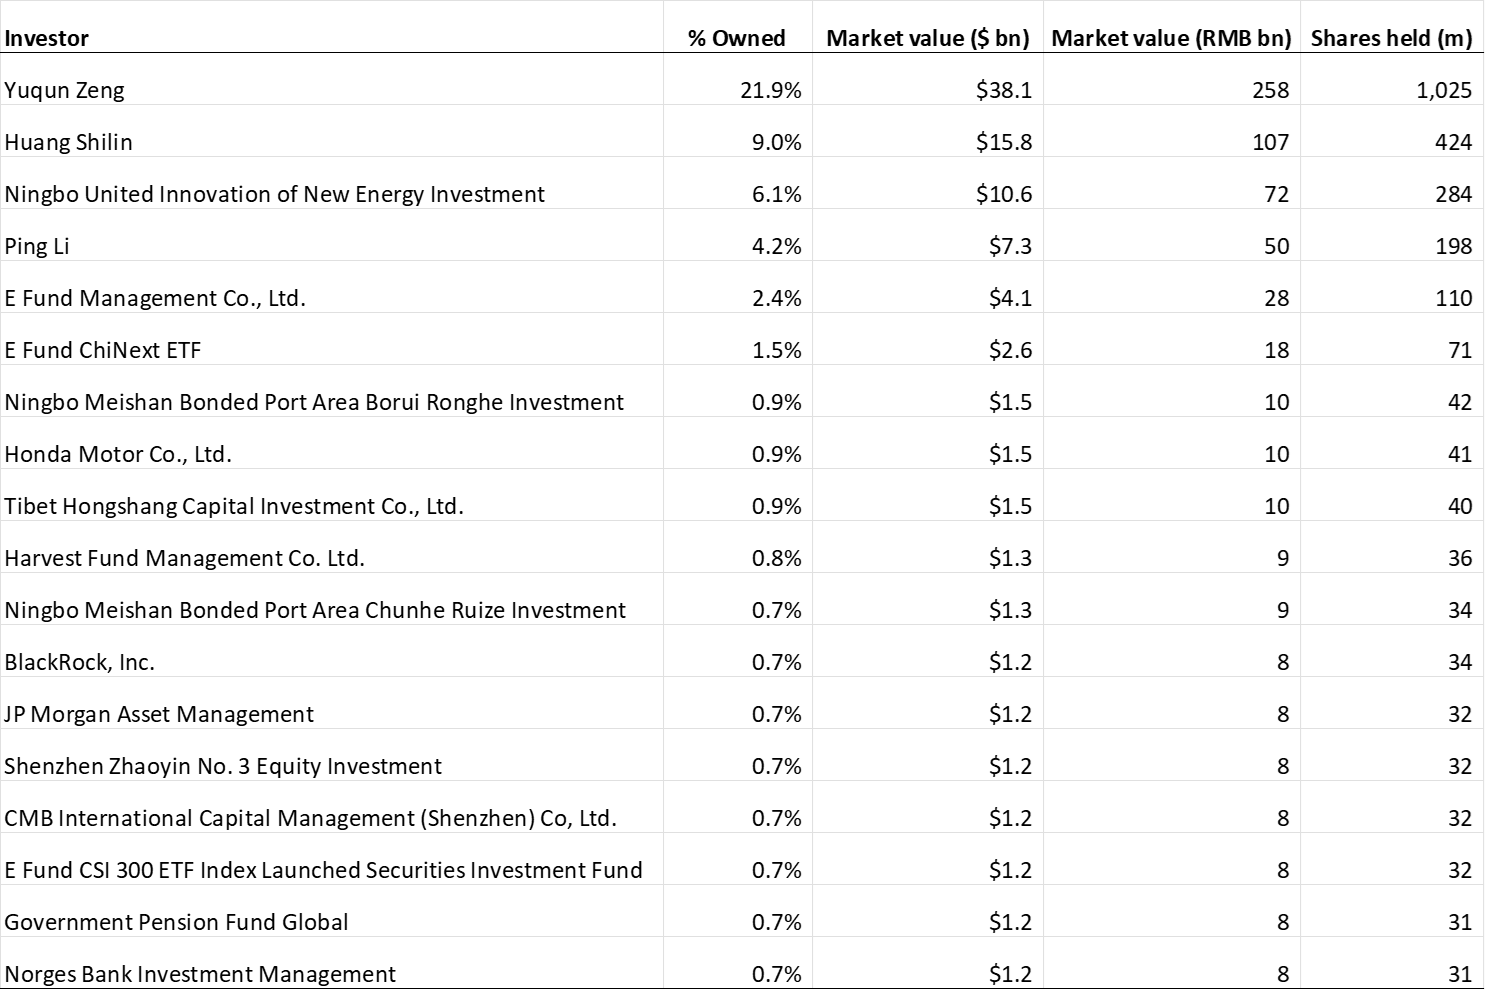
Top shareholders
Enjoyed this research?
Receive our future Research and Frontier Briefings.
Frontier Lane also works with a select group of long-term investors, founders and family offices on capital allocation and investment strategy.